May 4, 2023
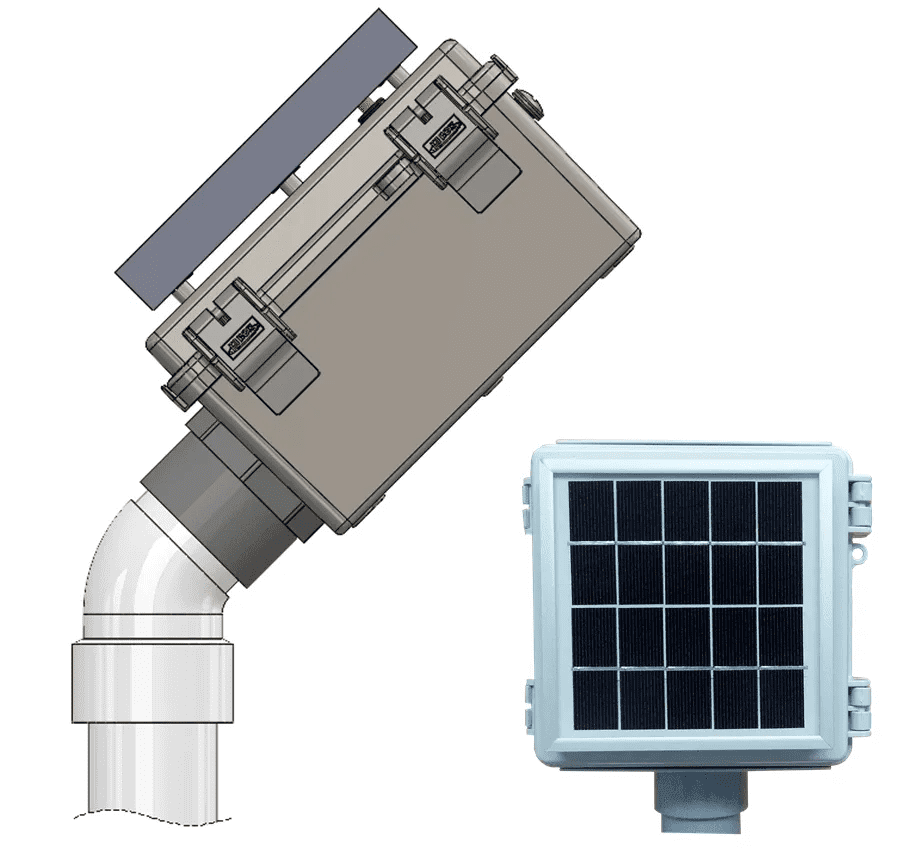
The Acclima Solar DataSnap is a simple-to-use data recorder (data logger). It provides the ability to read and log soil moisture sensor data from a variety of SDI-12 sensors. Convenient, fast data collection is supported through a micro-USB thumb drive. Alternatively, the Solar DataSnap can be attached via USB directly to a Windows PC laptop to which the data can be downloaded and viewed from the SnapView software. Each Solar DataSnap supports up to 10 SDI-12 soil water content sensors.
The Solar DataSnap handles all timing requirements of the SDI-12 communications protocol, making it possible to take SDI-12 sensor readings using a simple terminal program such as HyperTerminal or PuTTy.
Solar DataSnap Hardware Features
SnapView Software Features
What is included?
The Acclima Solar DataSnap will support all SDI-12 sensors that are compatible with versions 1.0 through 1.4 of the SDI-12 Protocol Specification, including all Acclima SDI-12 sensors. However, the Solar DataSnap only reads and records the first five data points of the SDI-12 M! command. The Solar DataSnap’s internal data recording functions do not support reading or recording of any other data points.
The Solar DataSnap is limited to 500mA. Some sensors with higher power requirements may require an external power connection.
The Acclima SnapView software supports all SDI-12 soil moisture sensor types.
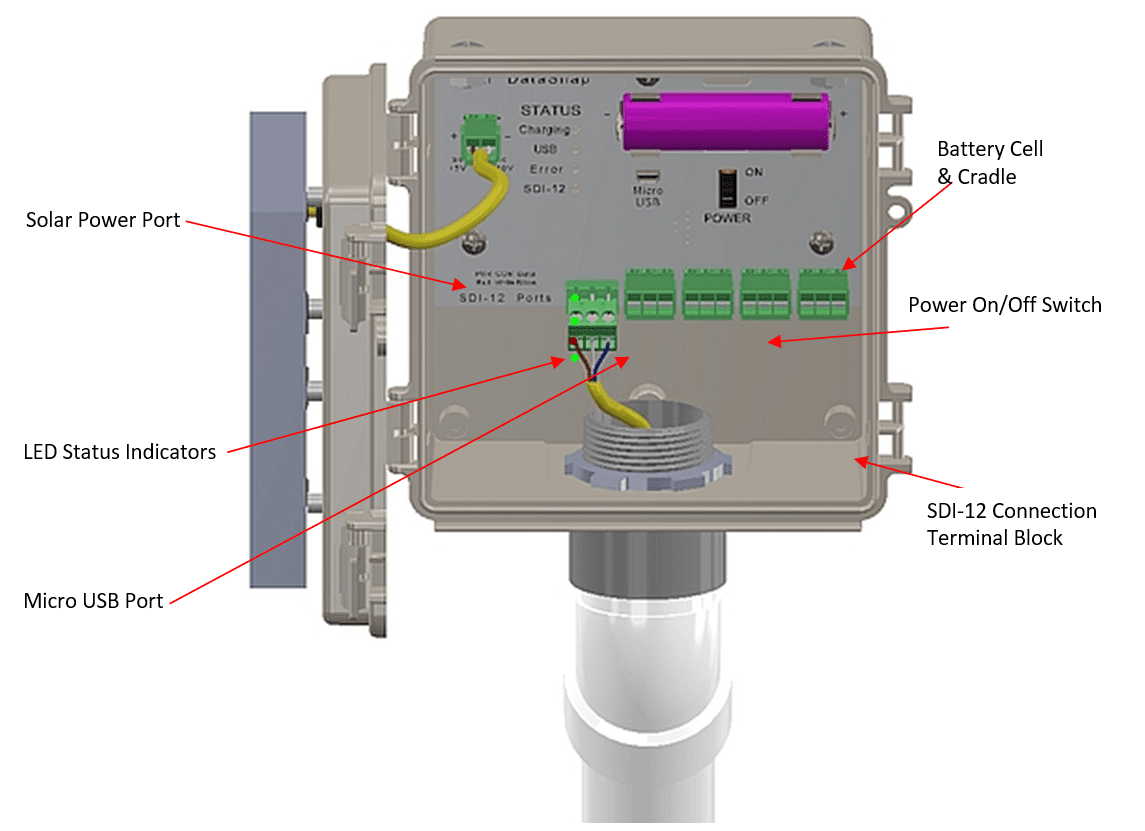
The Solar DataSnap has the following connections:
USB
After software installation, the included USB cable can be used to connect to a PC or a micro-USB spin thumb drive can be plugged in to automatically download the csv data files for a spreadsheet program.
SDI-12
The terminal block can be unplugged from the DataSnap while wiring sensors together. Multiple sensors can be wired in parallel to the same SDI-12 port.
Solar Power Port
This connection from the Solar Panel provides 5-10 volts for the battery cell charging circuit.
Note: Turn the On/Off Switch to ‘ON’ at the beginning of a data collection cycle. Turn to ‘OFF’ when storing the logger in the Winter.
The Solar DataSnap utilized 4 status LEDs as follows:
Charging LED
The green charging LED will illuminate when the charging circuit is active. This will occur with voltage applied from the Solar Panel, or when plugged into a USB power source.
USB LED
The green USB LED will illuminate when there is an active USB connection. This occurs when connected to a computer with proper drivers installed, or it occurs when a USB Thumb drive is plugged in and in use. The light will be on solid to show a valid connection has been established and will blink when there is activity over the USB connection. When using a USB charger, the USB light will not turn on, because there is no valid usable USB connection present. However, the charging light will come on to indicate that power is being drawn from the USB charger to charge the battery.
When using a thumb drive:
Plug in the USB thumb drive firmly into the micro-USB port. Wait a second to allow the USB connection to stabilize and link to the drive. The USB light should then come on and blink to indicate data flow to the thumb drive. When the LED turns off and stays off, the thumb drive can be removed.
Error LED
The red error LED on the Solar DataSnap performs the same function as on the original DataSnap – reporting communication errors and short circuit errors.
SDI-12 LED
The green SDI-12 LED will be off when the SDI-12 port is not active. When the port is active, the LED will turn on and will blink when there is communications traffic over the SDI-12 bus.
Power ON Battery Test
When turned on, the green USB and SDI-12 LEDs will flash together to indicate power is present. If the battery voltage is low, the red error LED will flash once.
A Word About Operating Temperature
The Acclima Solar DataSnap has physical limitations on what temperature range it will fully operate in. If it will be used in freezing weather (≤0°C or ≤ 32°F) for extended periods of time, the end-user should plan to periodically have the lithium-ion 18650 battery swapped out for a fully charged replacement because the battery charging circuit is disabled at 0°C and 32°F. The battery will still run the data logger for the duration of the remaining charge, but it will not get recharged at or below those temperatures. Note: When recharging backup batteries in a desktop charger, care should be taken to allow the batteries to warm up to room temperature before recharging them or the battery could be permanently damaged.
Similarly, if the temperature inside the enclosure exceeds 50°C or 122°F the battery will stop charging.
The SnapView software must be installed prior to connecting the Data Snap to the computer. The Data Snap requires a Windows™ driver to be installed before use. The driver is installed during the installation of the SnapView software.
Once the software is installed, connect the Data Snap to the computer via a USB cable. Windows™ will automatically detect the new Data Snap hardware and will attempt to find the appropriate driver. This driver installation process will only occur once per Data Snap. Each new Data Snap will follow the same process.
IMPORTANT NOTE! Be sure to install the SnapView™ software before connecting the DataSnap to your PC’s USB port!
The SnapView software can be downloaded from the Solar DataSnap product page.
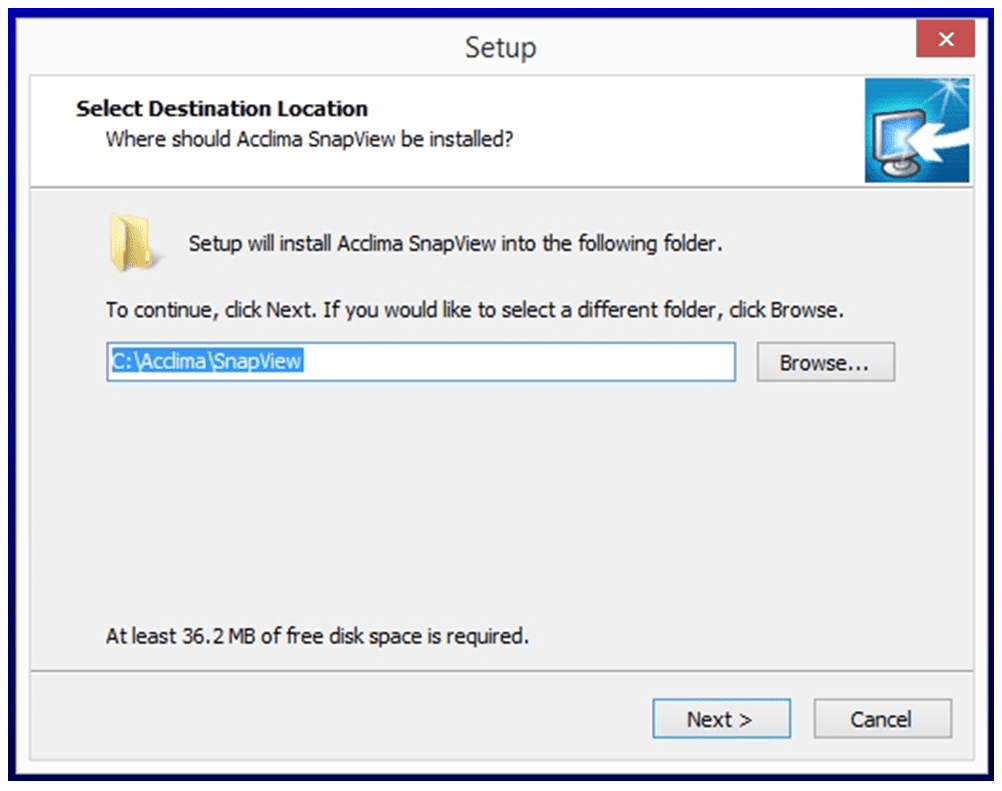
Figure 2
When the Data Snap is first connected to the computer, it will automatically be detected and the installation of the driver will begin.
Windows™ will then search for the driver in its pre-configured driver folders. This will happen because the driver was installed to this location when the SnapView software was installed.
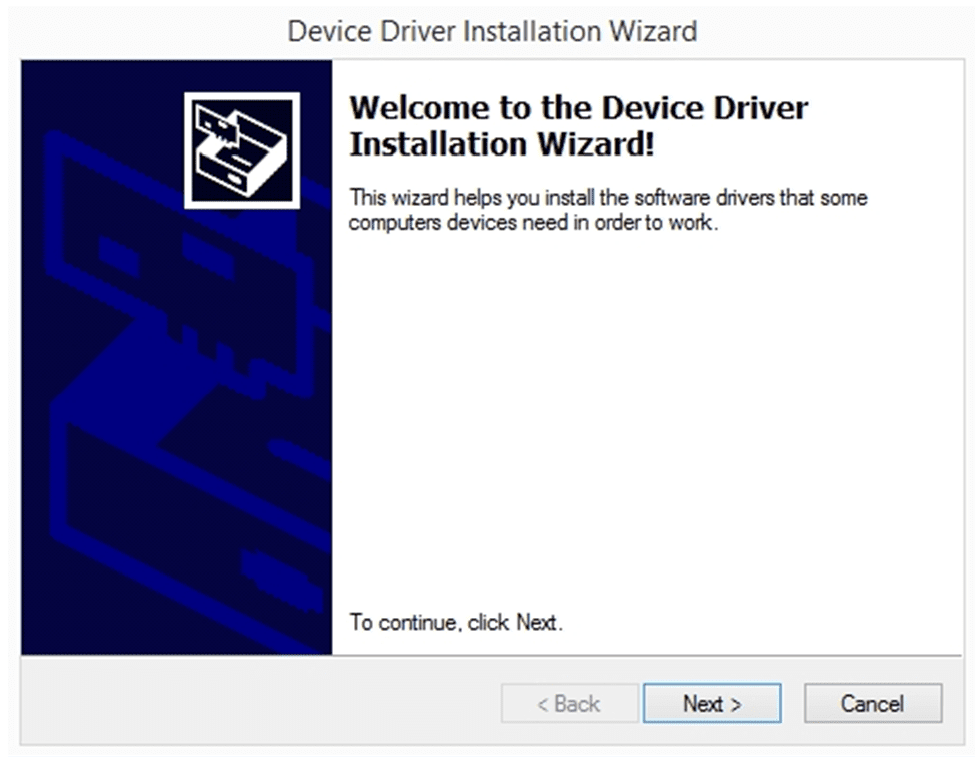
Figure 3
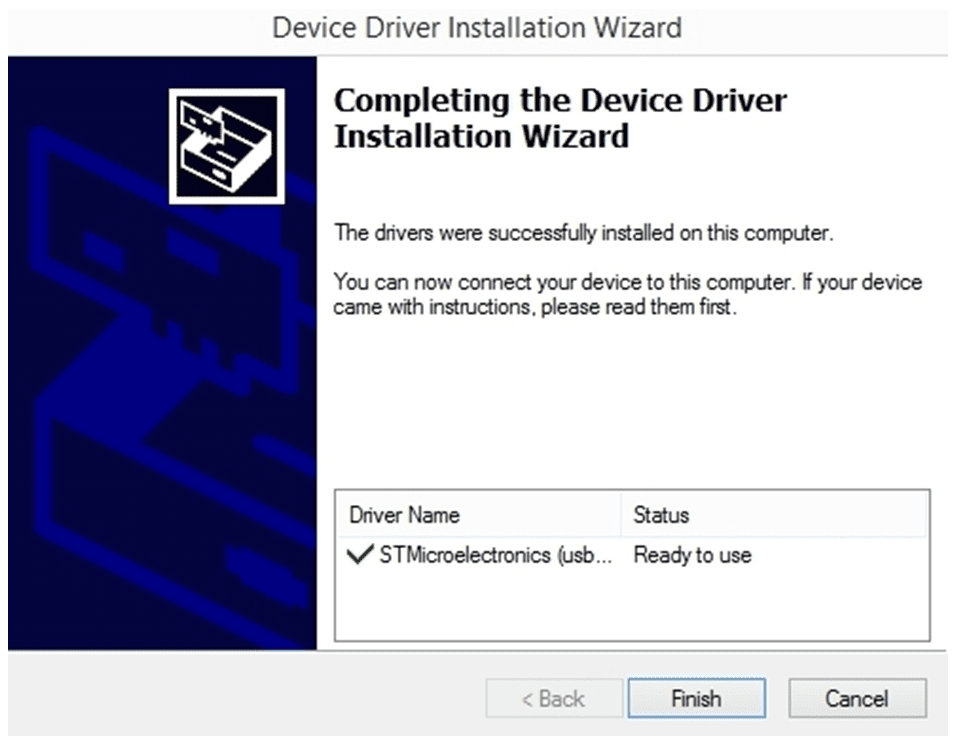
Figure 4
Installing the driver on Windows™
When the Data Snap is first connected to the computer, it will automatically be detected and the installation of the driver will begin.
Windows™ will then search for the driver in its pre-configured driver folders. This will happen because the driver was installed to this location when the SnapView software was installed.
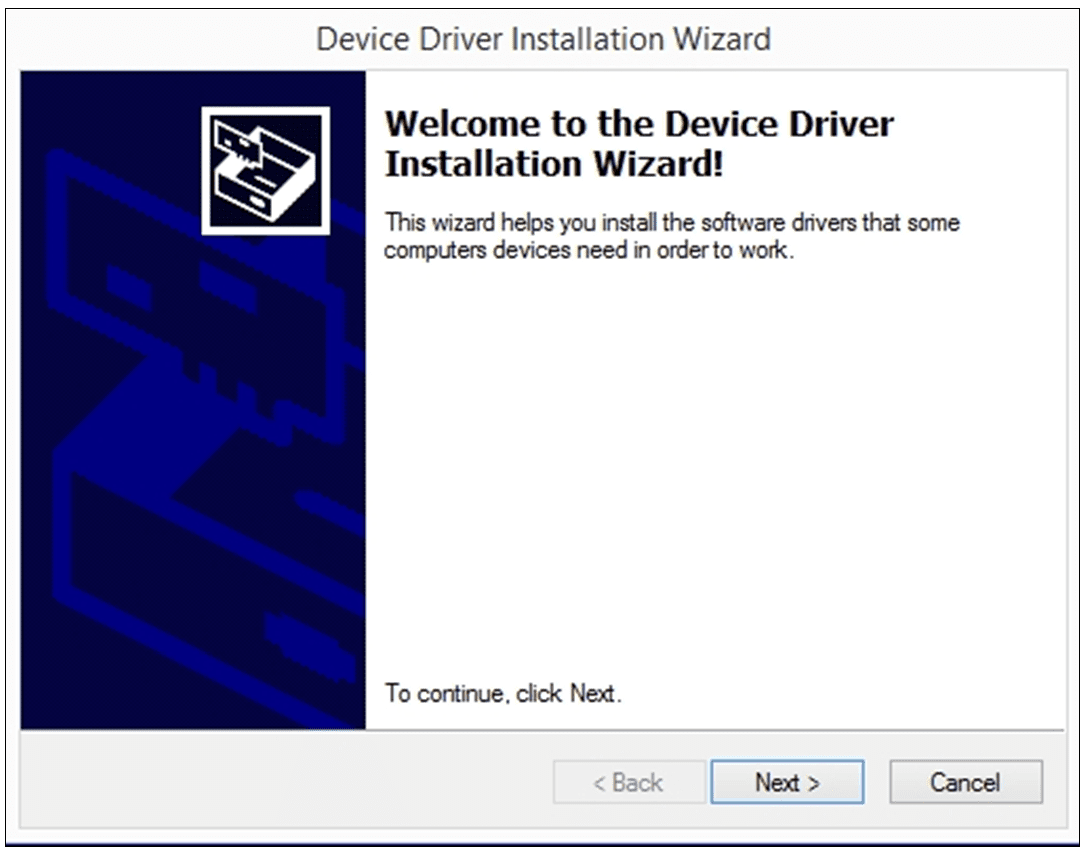
Figure 3
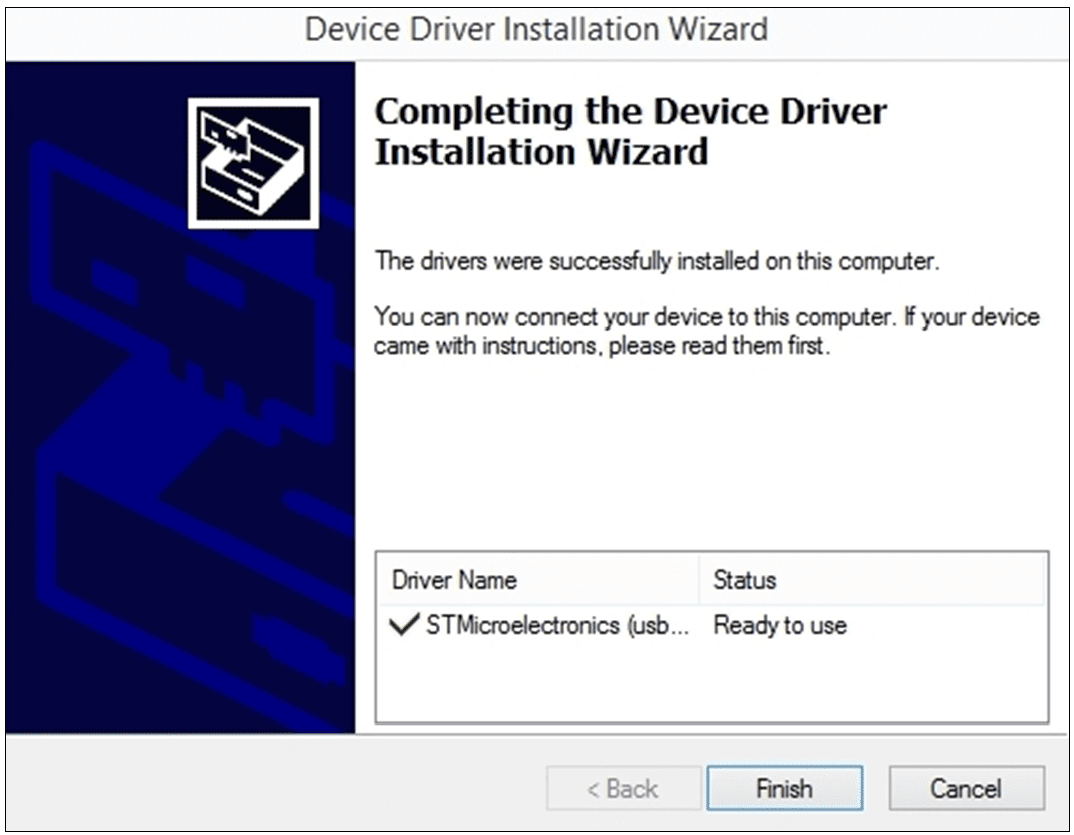
Figure 4
To view more details about the port, open the ‘Device Manger’ in the Control Panel. The Data Snap is visible in the Device Manager under the ‘Ports (COM & LPT)’ heading. The Device Manager only shows ports that are active. When the Data Snap is disconnected from the computer, it will no longer be visible in the Device Manager.
The Acclima SnapView software provides four important functions:
The DataSnap can communicate with and read any type of SDI-12 soil water content sensor. It is not limited to Acclima sensors or probes. The DataSnap must be configured to know which sensors to read. This is easily done in the ‘Configuration’ section of the SnapView software. To add sensors, go to the ‘Sensors’ screen and click ‘Add Acclima Sensors’ or the ‘Add a Single Sensor’ at the bottom of the screen.
The SDI-12 protocol does not provide a way to search for multiple connected sensors. Therefore, only one sensor can be connected to the DataSnap when adding a sensor. This is only true for non-Acclima sensors and requires the use of the ‘Add a Single Sensor’ option.
Acclima has engineered a more efficient and intelligent way to configure multiple Acclima sensors simultaneously. This significantly simplifies the configuration process and is done using the ‘Add Acclima Sensors’ option.
The process for adding sensors to a DataSnap is as follows:
To add one or more Acclima sensors to the DataSnap:
Each non-Acclima sensor must be added individually to the DataSnap. To add a non-Acclima sensor to the DataSnap:
The DataSnap does not support duplicate serial numbers. If there are multiple sensors with the same serial number, the sensor that was configured last will be used.
Each sensor has its own unique set of reading descriptions which can be modified. This includes a descriptive sensor name and descriptive names for each of the five sensor readings. To modify sensor settings, click on the sensor in the ‘Configured Sensors’ list. The details for the selected sensor will display. Make any desired changes and click the ‘Save’ button.
When a sensor is added, its reading descriptions are automatically set based on the defaults for this type of sensor. These default reading descriptions can be modified or removed using the ‘Manage Reading Descriptions’ screen in the Tools menu. If there are no defaults for a particular sensor type, SnapView can automatically create them. This occurs the first time a user enters reading descriptions on the ‘Sensor Details’ window and clicks ‘Save’. For more details, see the ‘Using Acclima SnapView Software’ section later in this document.
There may be times when it is necessary to remove a configured sensor since it is no longer needed or to make room for a new sensor. This is easily done by clicking the ‘Remove Sensor from DataSnap’ button at the top of the ‘Sensor Details’ window. This does not remove any data from the PC, it only removes it from the configuration on the DataSnap.
Soil moisture sensors should be located in the region of interest where soil moisture measurements are desired. Acclima sensors measure the average volumetric water content over the length of the sensor rods. Sensors can be buried in any orientation and will produce average readings as follows:
When selecting a site for sensor placement, consider the following environmental factors:
The Acclima Soil Moisture sensors report soil moisture as a percentage of the total volume measured. This means that the measured volume of soil should be free of foreign objects or variations that may alter the measurement made by the sensor. Consider the following conditions:
SDI-12 sensors communicate and draw power from the same wires. They share the connection to the Solar DataSnap with all other sensors connected to the same Solar DataSnap. This type of a connection is sometimes called ‘parallel’ or ‘bussed’. Sensors can be spliced or connected together at a single common point or as taps into a longer run of wire.
Upon wiring completion:
Consider the following points when wiring sensors:
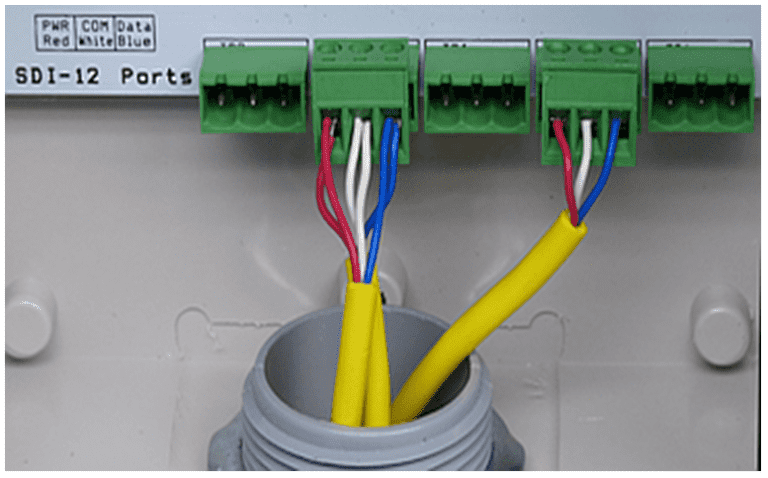
Figure 5 - Five SDI-12 Ports
Upon wiring completion:
Consider the following points when wiring sensors:

Figure 6 – Basic Wiring Diagram

A DataSnap must be configured prior to its first use. The SnapView software guides you through the configuration process in a few simple steps. To access the Configuration screen, click on the ‘Config’ button at the top of the screen. This will display the Configuration wizard.
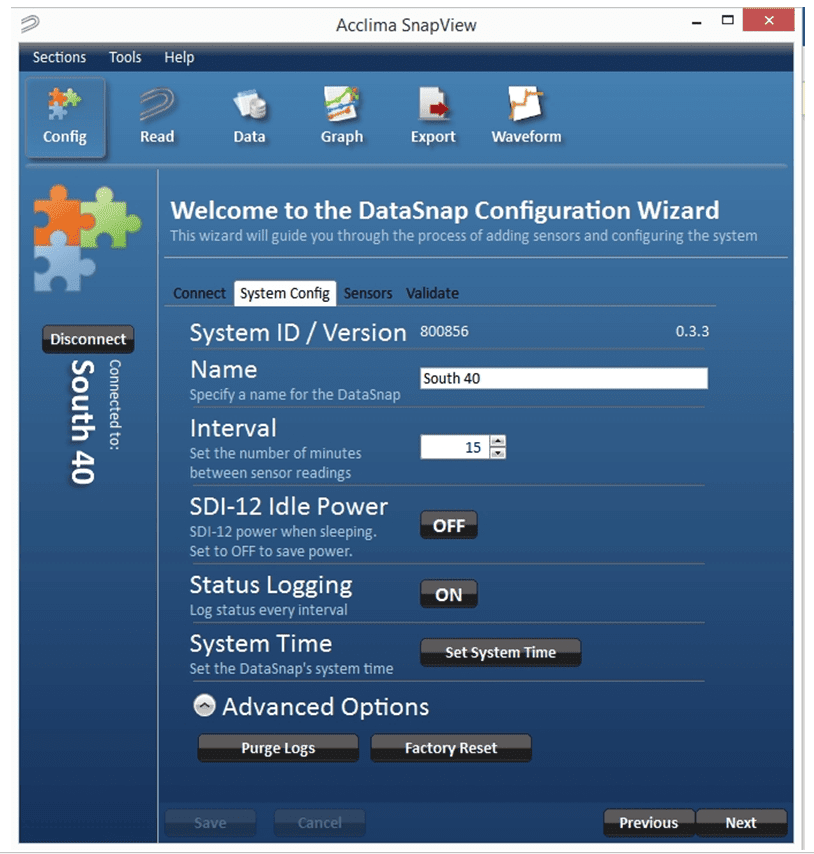
Figure 7 – Configuration
For a DataSnap to automatically take sensor readings or allow a user to read sensors manually, it must be configured. The most important step is to tell the DataSnap what sensors to read. This requires that the sensors be connected to the DataSnap during the configuration process. It is also important to provide a name for the DataSnap and to define how frequently it will take automatic readings. DataSnap configuration settings are stored on the DataSnap and are retained even when power is removed. The configuration wizard is divided into four steps:
The initial configuration screen shows all DataSnaps that are currently connected to the computer. To begin configuring a DataSnap, click the ‘Connect’ button next to the desired DataSnap. The name of the connected DataSnap will appear on left side of the screen and the ‘Next’ button is enabled. Use the ‘Next’ and ‘Previous’ buttons to move through the configuration steps. All configuration operations will be performed on the connected DataSnap.
Click the ‘Refresh List” button to scan the computer for DataSnaps and update the connection list.
The system configuration screen allows modification of several DataSnap settings and operations. They are:
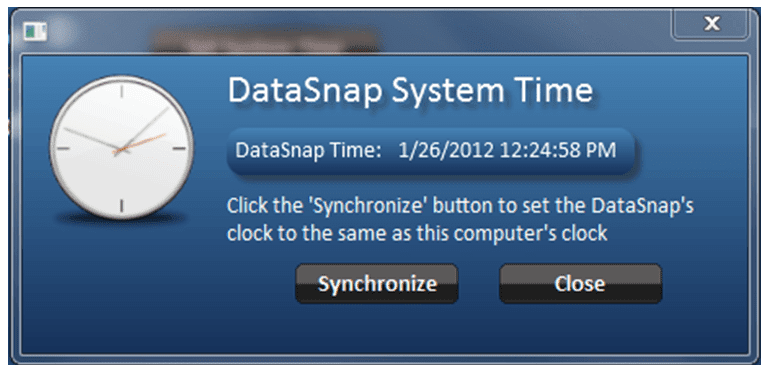
Figure 8 - System Time
Advanced Options – Click on ‘Advanced Options’ to display additional operations.
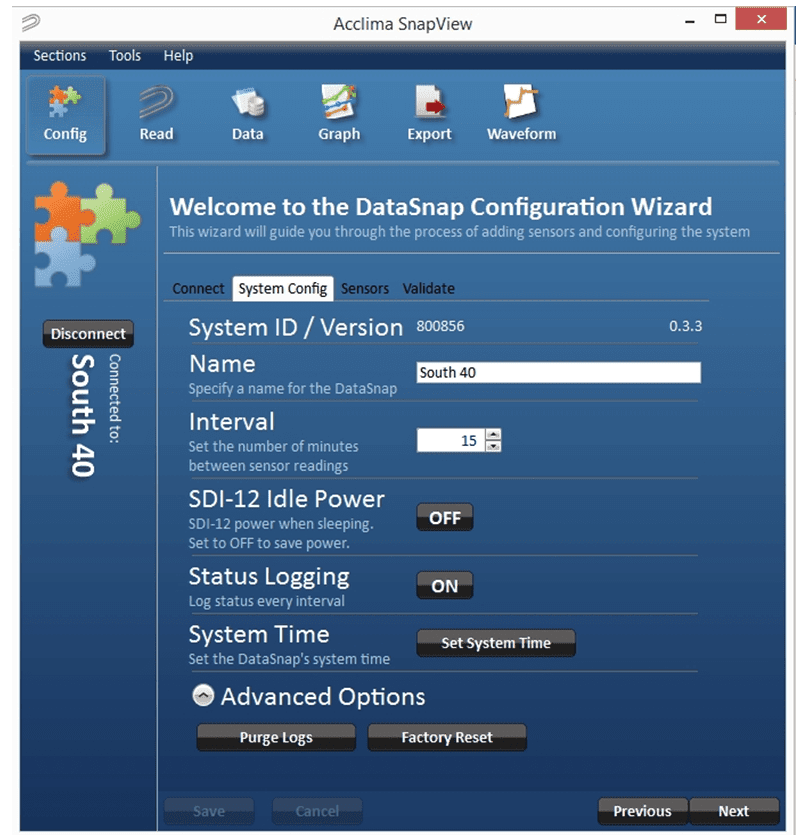
Figure 9 - System Configuration
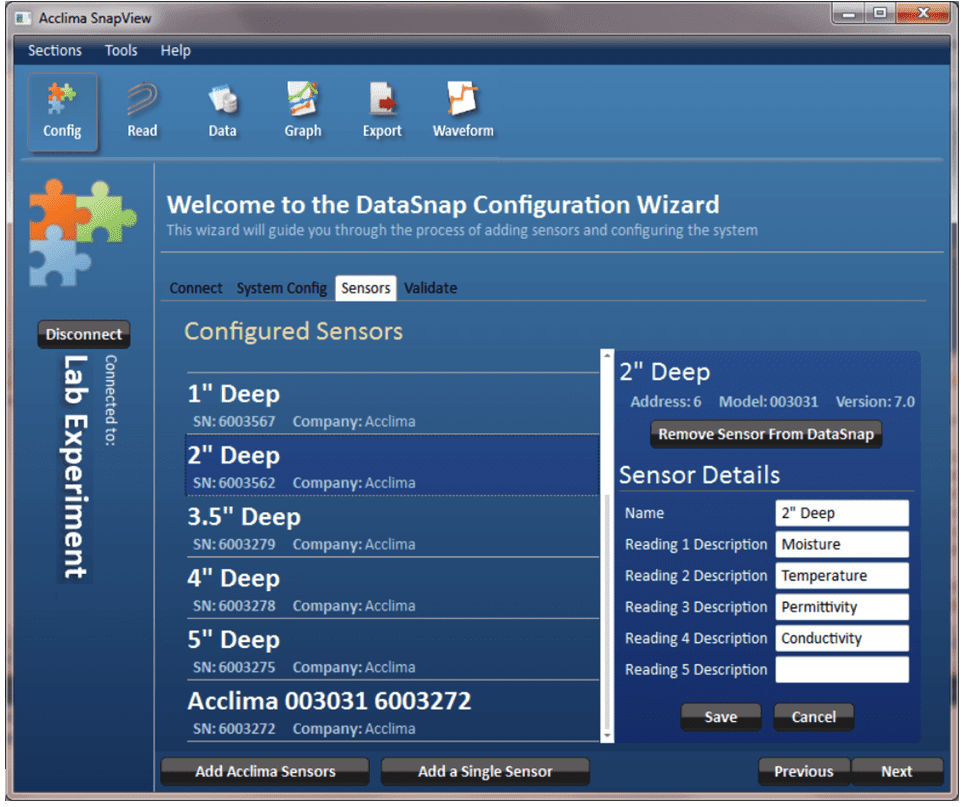
Figure 10 - Adding Soil Moisture Sensors
Sensor validation provides a simple way to verify that all configured sensors are correctly wired into the DataSnap and match the DataSnap’s configuration.
Connect all sensors to the DataSnap and click the ‘Validate’ button. The DataSnap will attempt to find and validate each of it configured sensors. Sensors that are found and match the DataSnap configuration are annotated with a green check mark. Sensors that are not found or do not match the configuration show a red X and an error description. See Figure 11 .
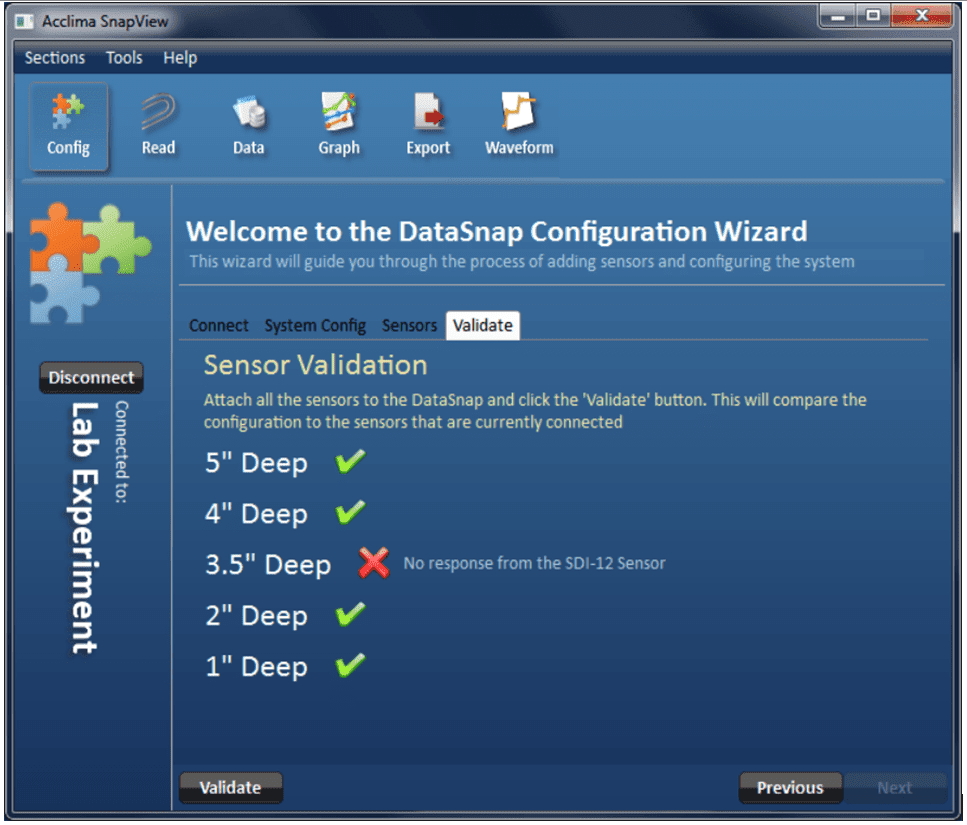
Figure 11 - Soil Moisture Sensor Validation
Sensor validation is the final step in the configuration process. It provides a simple way to verify that all configured sensors are correctly wired into the DataSnap and match the DataSnap’s configuration.
Connect all sensors to the DataSnap and click the ‘Validate’ button. The DataSnap will attempt to find and validate each of it configured sensors. Sensors that are found and match the DataSnap configuration are annotated with a green check mark. Sensors that are not found or do not match the configuration show a red X and an error description. See Figure 17 .

Figure 13 - Sensor Validation
The SnapView software regularly attempts to synchronize with all connected DataSnaps. This occurs in the background and is therefore no user interaction is required. During synchronization, a green status icon is displayed in the upper right corner of the screen. Hovering the mouse over the icon displays the number of logs that still need to be retrieved from the DataSnap as shown in Figure 12.
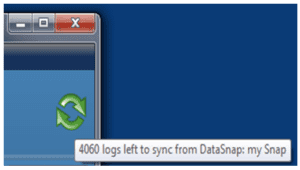
Figure 12 - Synchronization

Each DataSnap can accommodate up to 10 sensors. The connected sensors can be manually read at any time. Prior to reading any sensor, the sensor must be connected to and configured on the DataSnap. This is a one-time process and is covered in detail in the ‘Configuration’ section. Manual readings do not occur automatically and are not saved for historical analysis.
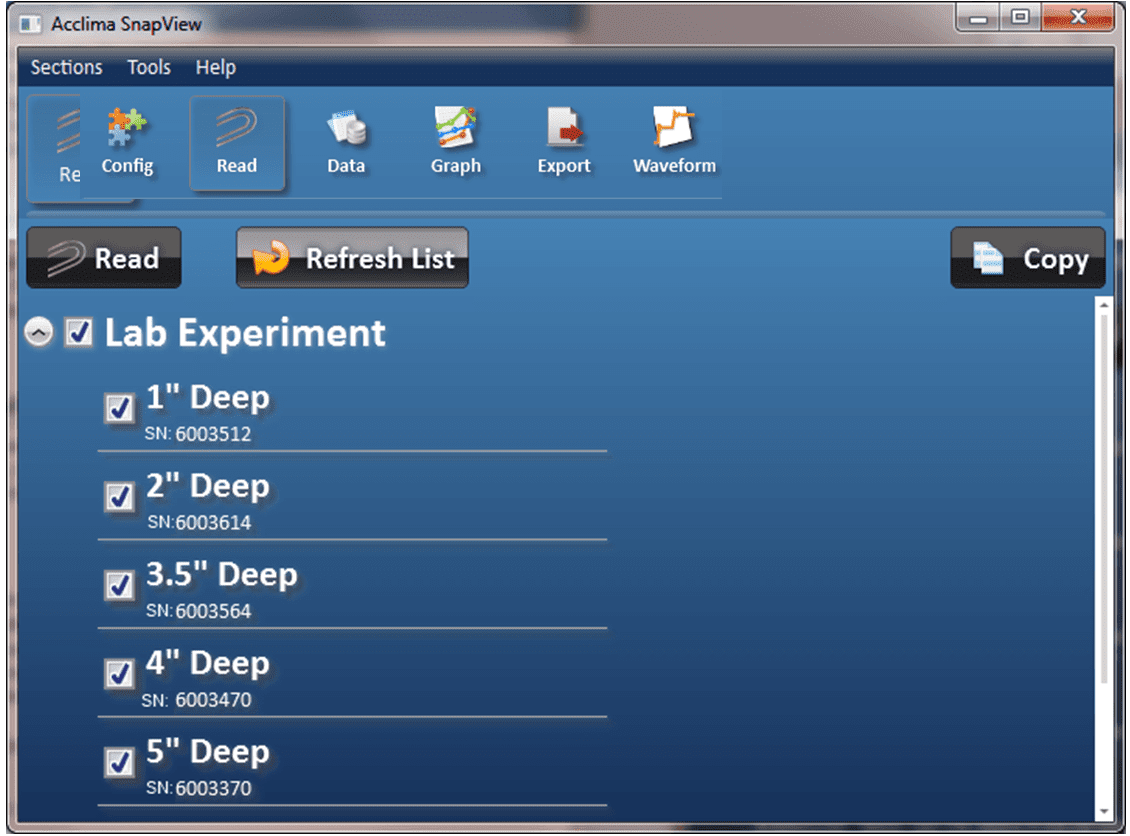
Figure 13 - Initial Read Sensor Screen
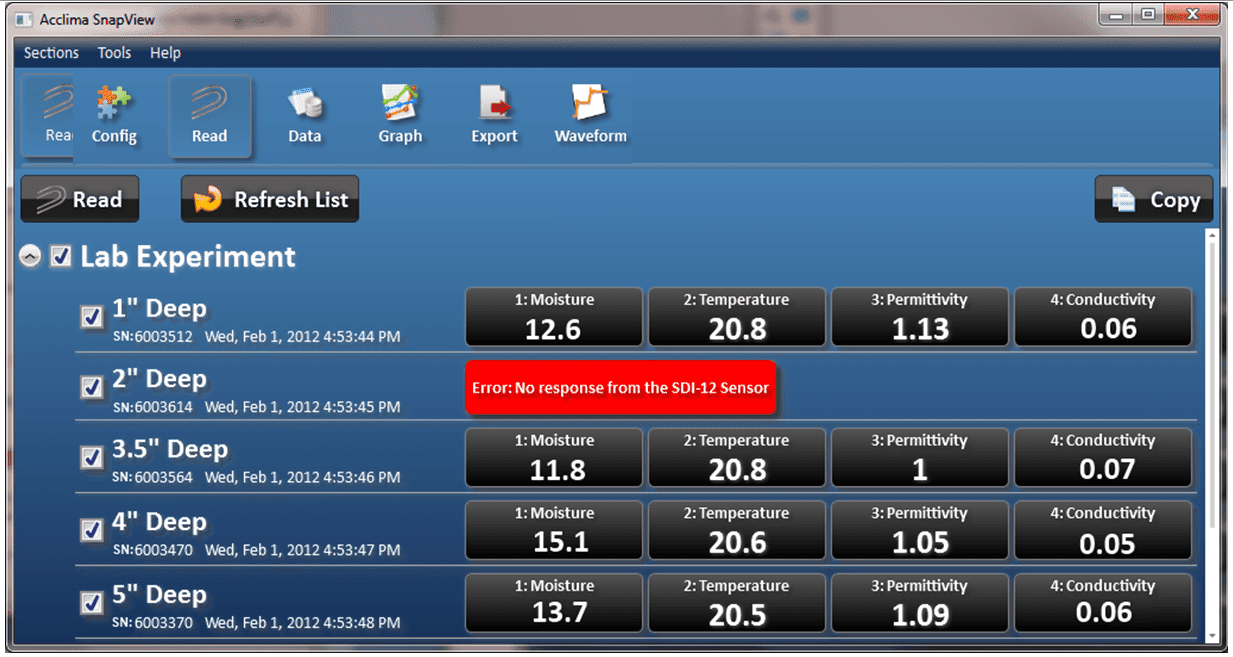
Figure 14 – Read Sensors
Sensor readings for all sensors can be viewed visually through the ‘Graph’ screen. To see the ‘Graph’ screen, click on the ‘Graph’ button at the top of the screen. The graph view allows access to the historical data of each DataSnap that has ever been connected to this PC. It does not require a DataSnap to be connected.
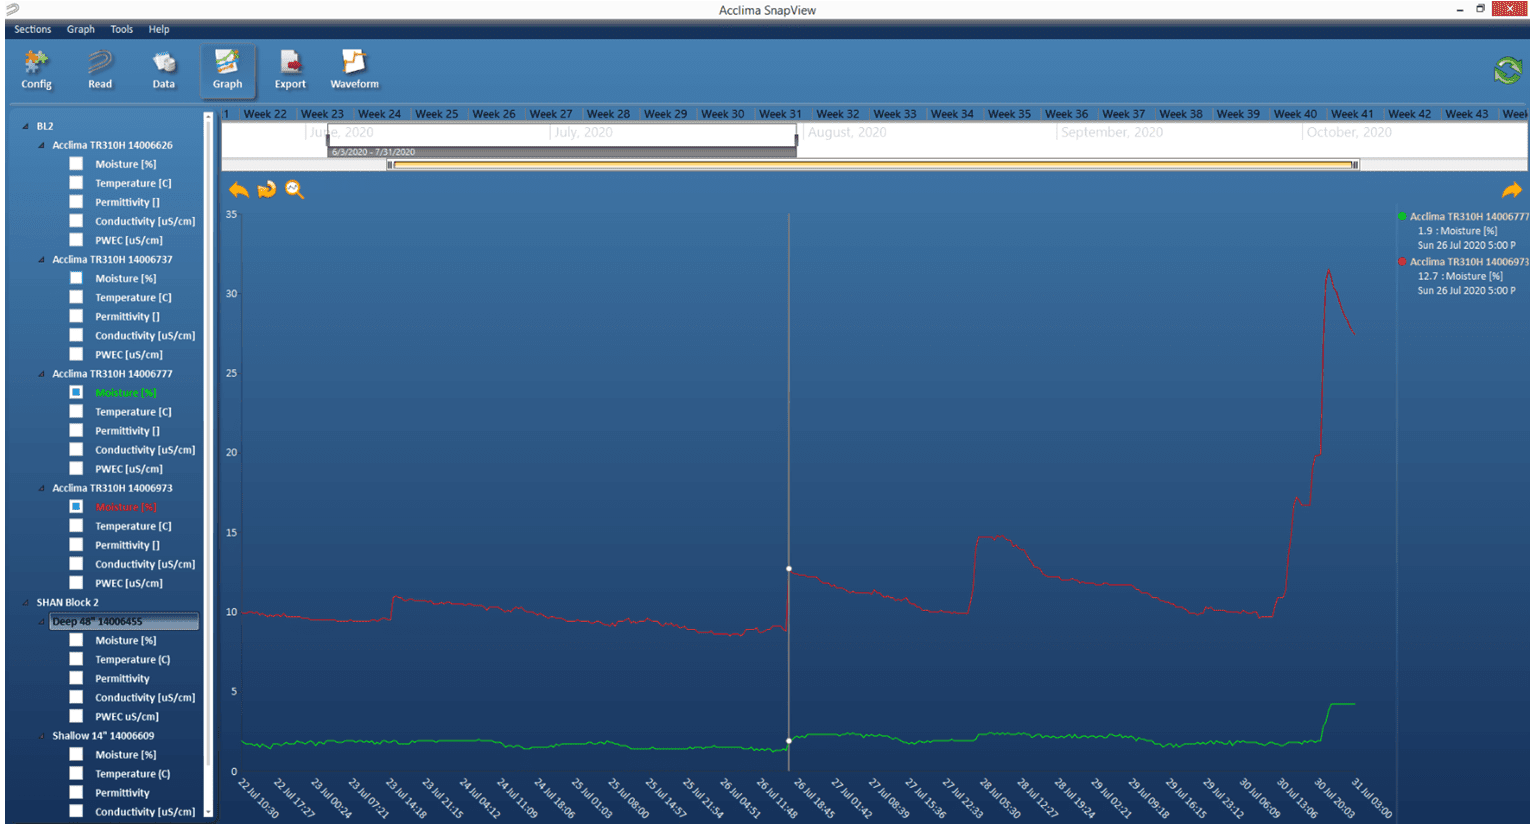
Figure 15 – Data in Graph View
The Graph view has three main sections.
Click the ‘Graph’ button at the top of the screen.

Figure 16 – Date/Time Selection
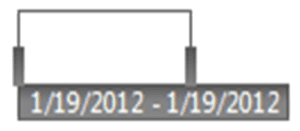
Figure 17 – Time Bar Selection Window
The date range can be adjusted by dragging the gray rectangles on the right and left boundaries of the range selection window. Dragging the left most range indicator to the left will change the displayed start date in the main graph to an earlier date. Dragging it to the right will change the displayed start date in the main graph to a later date. The right most range indicator behaves similarly and effects the end date on the main graph. The selected date range is displayed immediately below the range selection window.
To maintain the same number of days in the date range but to see a different range, simply click anywhere in the selection window and drag it to the right or left.
To select a single day, click on the date in the blue region at the top of the time bar . As an example, Figure 18 shows that Thursday January 19, 2012 has been selected. To select multiple full days, left click on a date and while holding down the left mouse button, drag to another date and release the button. The selection range will be highlighted in yellow as the mouse is dragged. The selection window will now change to the range that was selected. As an example, Figure 18 shows how the time bar would look while clicking ‘Wed, 18’ and dragging to ‘Fri, 20’. Once the mouse is released, the range selection window will move and the main graph will display data for the three selected days.
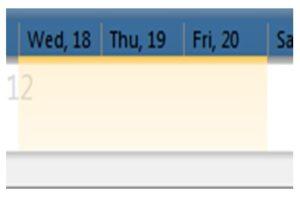
Figure 18 - Selecting Multiple Days in the Time Bar

Figure 19 - Time Bar Scrollbar Showing Months
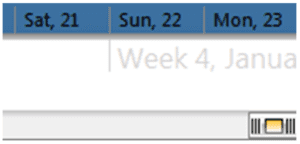
Figure 20 - Time Bar Scrollbar Showing Days
Plug in the USB thumb drive firmly into the micro-USB port. Wait a second to allow the USB connection to stabilize and link to the drive. The USB light should then come on and blink to indicate data flow to the thumb drive. When the LED turns off and stays off, the data has been gathered and the thumb drive can be removed. Do not remove the drive while in the middle of the process! File fragmentation and data loss will occur.
Data is stored to the following folder\file structure. If the folders or files do not exist, then the Solar DataSnap will create them. In this example, Solar DataSnaps serial numbers 112233, 445566, 778899 have been synchronized with the thumb drive.
Bold: = Drive letter
Italics\ = folders
Standard text = files
F:
Acclima\
DataSnap\
Data\
112233\
112233_Data.csv
112233_Errors.csv
112233_StatusLogs.csv
112233_SyncPos.bin
112233_SystemInfo.csv
445566\
445566_Data.csv
445566_Errors.csv
445566_StatusLogs.csv
445566_SyncPos.bin
445566_SystemInfo.csv
778899\
778899_Data.csv
778899_Errors.csv
778899_StatusLogs.csv
778899_SyncPos.bin
778899_SystemInfo.csv
Updates\
ACEFW_46_0_3_4.WAF
When synchronizing a second time with the Solar DataSnap, it is preferable to use the same thumb drive without deleting the data. The Solar DataSnap will make note of what log data is already on the thumb drive and will then append any new data to the same files. This applies to Data, Error, and Status Logs files. System Info files will be overwritten with current system information (which includes configuration and status information).
Update files may be placed in the Updates folder on a thumb drive to upgrade the Solar DataSnap to a new version. The Solar DataSnap will examine the upgrade file and will only proceed with the upgrade if the file is a valid update and is a newer version than the firmware that already exists in the Solar DataSnap. This update method is secure and safe, and not subject to errors such as loading the wrong file onto the drive (it will just skip over it). It should be noted that the file must use the .WAF file extension (case sensitive!) to be considered and examined as a possible update candidate.
Sensor readings can be viewed in a spreadsheet format in the ‘Data’ screen. Click on the ‘Data’ button to access the ‘Data’ screen. The data view allows access to the historical data of each DataSnap that has ever been connected to this PC. It does not require a DataSnap to be connected.
Select one or more sensors from the list to see the data in the grid.
Different types of sensors will have different types of data in each of the five readings therefore the column headers are named generically. To see the description of each of the sensor’s readings, click the sensor in the list at the left. The node will expand to show the description of each reading. Errors can be viewed by selecting the ‘Errors’ in the list to the left. Errors are displayed in a separate grid. When both grids are displayed, the grid size can be adjusted. To do this, hover the cursor over the horizontal border between the grids. The cursor will change to a vertical arrow. Click the left mouse and while holding down the left mouse button, drag up or down.
In Figure 21, two sensors have been selected. Those sensors are named ‘2” Deep’ and ‘4” Deep’. Their data is displayed in the grid to the right, sorted chronologically. The ‘2” Deep’ sensor has been expanded to show the names of its readings. The errors have also been selected and are displayed.
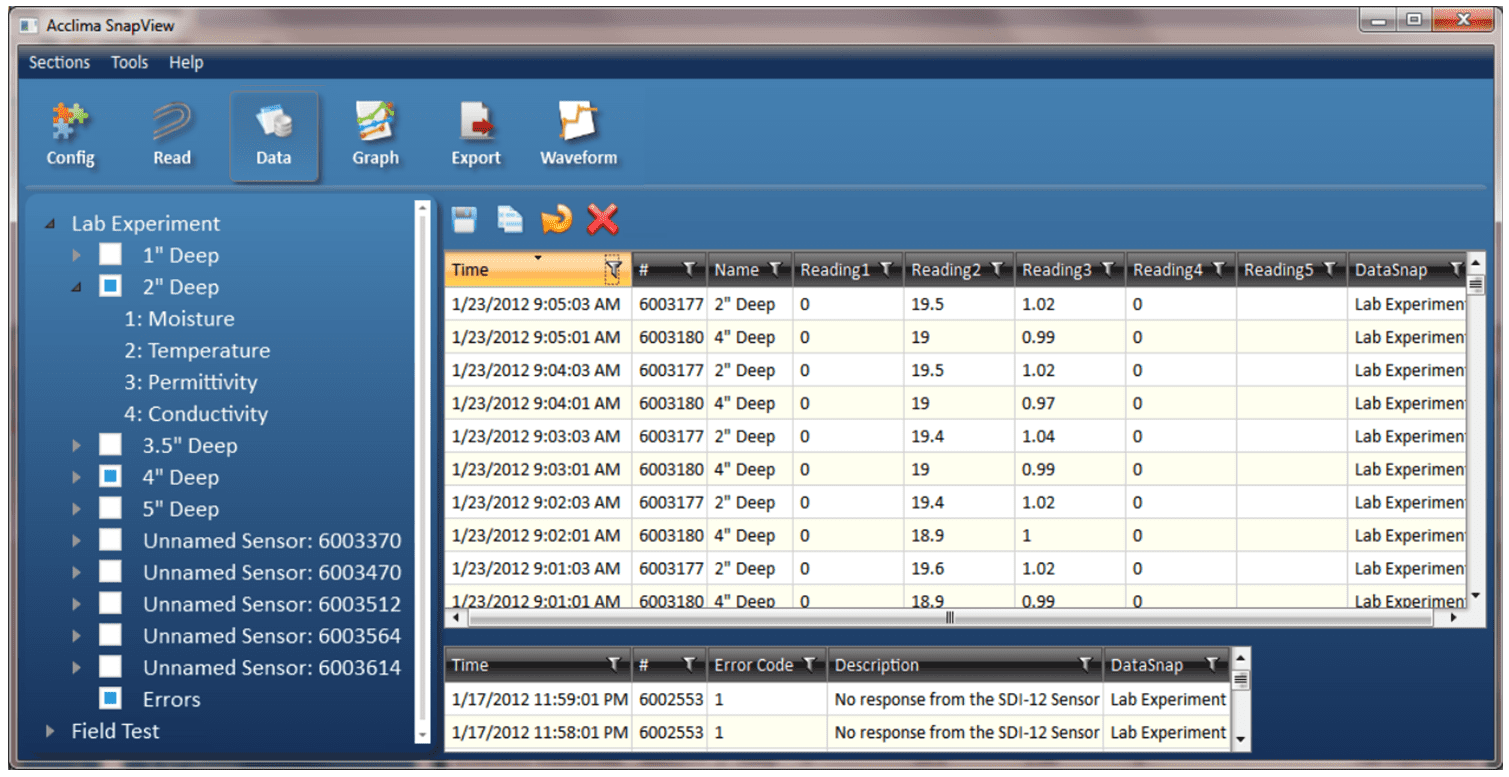
Figure 21 – Data in Grid View
There are several different operations that can be performed within the data screen. These are accessed via the options bar. They include:

To sort data in each column, click anywhere on the black column header. The data will now be sorted by that column heading. Clicking the header again will sort the column in the reverse order.
A filter may be applied to limit the amount of data displayed. Each column can be filtered and multiple columns may be filtered at the same time. To specify a filter for a column, click on funnel shaped icon in the header of the column. If the icon is white, no filter has been applied. If the icon is yellow, a filter has been applied.
In Figure 22 , a filter has been applied for the ‘Name’ and ‘Reading 1’ columns but not the ‘Reading 2’ column.

Figure 22 – Grid Filter Indicator
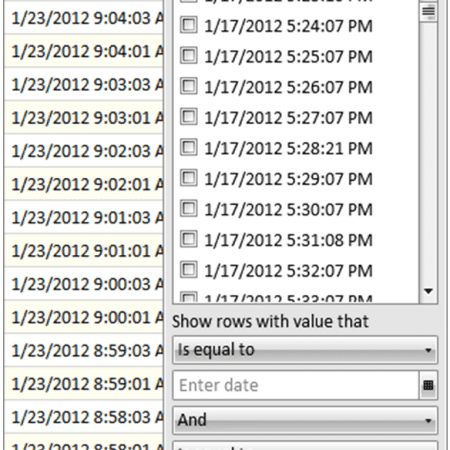
Figure 23 – Filter Window for the Time Column
The filter window displays a list of items that are available for display. Each item can be selected or not selected as desired. If an item is selected, it will be displayed in the grid. If it is not selected, it will be hidden in the grid. To select all items, click the ‘Select All’ option near the top of the filter window. Clicking the ‘Select All’ option a second time will deselect all items.
The list of items is dependent on the data in the column. Other custom filter criteria can be specified for complex scenarios. These are defined in the lower half of the filter window. These options allow range-based filtering. For instance, a filter could be set that displays all times between January 15, 2012 and January 18, 2012.
To remove the filter, click the ‘Clear Filter’ button.
Soil moisture sensor readings can be saved to a file in the Data screen. However, to export data on a larger scale, it is best to use the ‘Export’ screen. To see the ‘Export’ screen, click on the ‘Export’ button at the top of the screen. This will display the Export screen. This allows the option to export sensor data into other programs allowing greater flexibility and analysis of the data. You can export any of the data into other programs such as Microsoft Excel
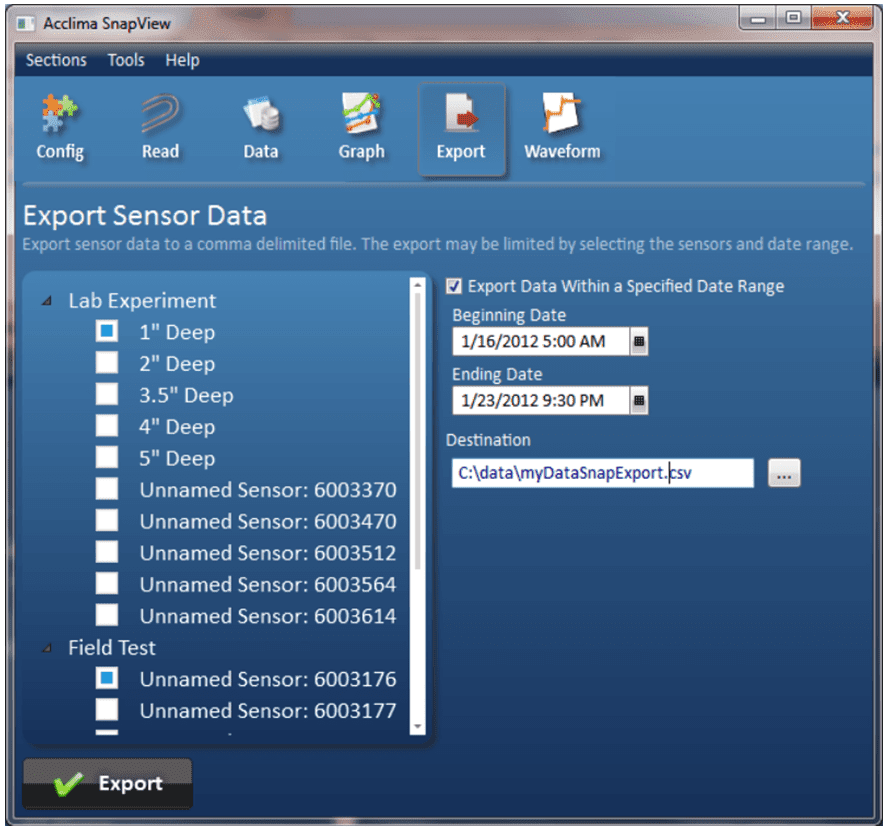
Figure 24 - Data Export
As an example, in Figure 24 , two sensors have been selected. The first selected sensor is named ‘1” Deep’ and is associated with the DataSnap named ‘Lab Experiment’. The second selected sensor is named ‘Unnamed Sensor: 6003176’ and is associated with the DataSnap named ‘Field Test’. Only data between 5am on January 16, 2012 and 9:30pm on January 23, 2012 will be exported. The output file will be named myDataSnapExport.csv and will be saved in the ‘C:\data\’ folder.
The tools menu contains several features. They include:
Acclima TDT and TDR sensors all use time-domain analysis of an electromagnetic wave propagated along the waveguide to derive measurement data. Some scientists or advanced users may wish to do their own analysis of waveform data, and so the Waveforms feature was added to the SnapView software to provide access to sensor waveforms. To access this new feature, the SnapView software and connected logging devices (DataSnap and Solar DataSnap) may need to be upgraded.
To run the Waveform Capture module in the SnapView software you will need to download and run the latest version of SnapView for Windows®. As of this writing, the latest version of SnapView is 1.4.1. The software can be downloaded here.
When the Waveforms view activates, the SnapView software will begin scanning all connected loggers and sensors to find devices that can support Waveform Capture. The software will prompt you to upgrade the logger firmware if Waveform Capture is not supported by the current logger firmware.

Figure 25 – Firmware Upgrade Prompt
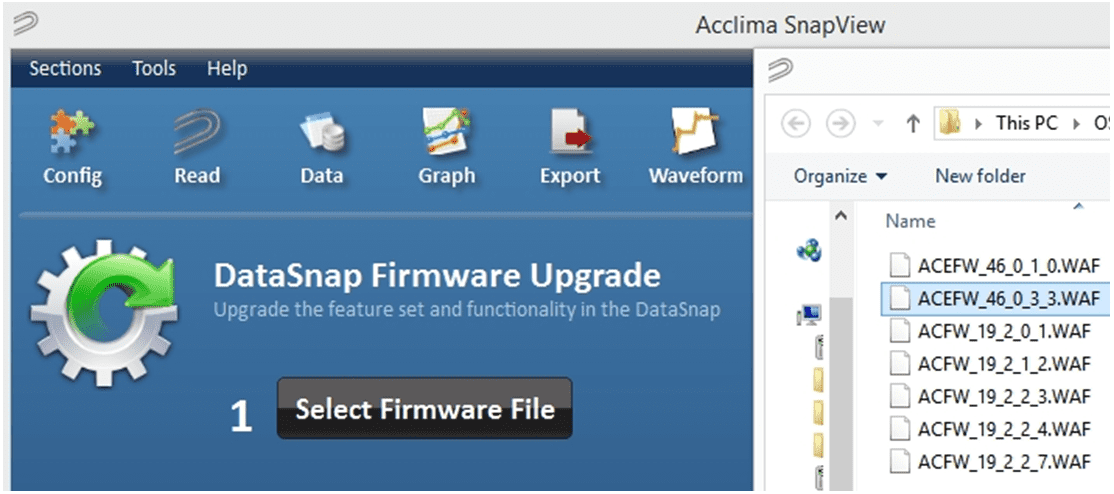
Figure 26 – Select Firmware
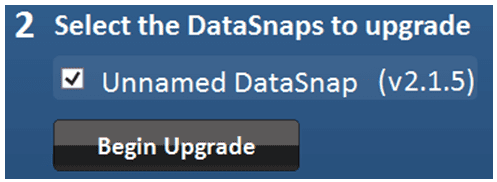
Figure 27 – Select DataSnap and Begin Upgrade
Once you have selected the proper firmware and clicked ‘Open’, left click the ‘ Begin Upgrade ’ button. You will then see a status bar for a few seconds while it progresses to 100%. A message box will then appear indicating that the upgrade was successful.
To open the waveform capture module in SnapView, click the ‘Waveform’ icon.

Figure 28 – Open Waveform Module

Note: If you left click the ‘Refresh List ’ button the software will look for any newly connected and configured sensors attached to the DataSnap. If the desired new soil moisture sens or is immediately shown, you may left click the
‘Stop’ button to stop the list from refreshing further.
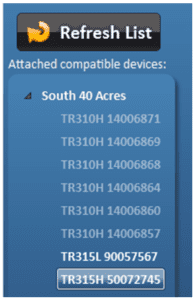
Figure 29 – Refresh List
With the sensor selected, left click the ‘Get Waveform ’ button to start the waveform graphing. A maximum of 12 waveforms can be displayed at the same time.
Waveform Capture enabled sensors

Figure 30 – Get Waveform

If you pull a waveform using an Acclima TDR that has “Waveform Capture ” printed on the label, the entire waveform at full resolution should show up within several seconds of clicking the ‘ Get Waveform’ button.
If you are using an older Acclima soil moisture sensor without the designation of being able to capture a waveform, you can still collect a waveform by selecting that sensor in the list and left clicking ‘ Get Waveform ’ button. The capture will begin, but due to the older design of the sensor it may take approximately 15 minutes to generate the graph. If you find that the capture is taking too long, you can cancel the capture by left clicking the ‘ Stop’ button.
You are also given options to adjust the data that is collected to speed up the collection process.

Figure 31 – Getting Waveforms From Older Sensors

Once the desired parameters have been entered, click the ‘Get Waveform’ button to begin the process.
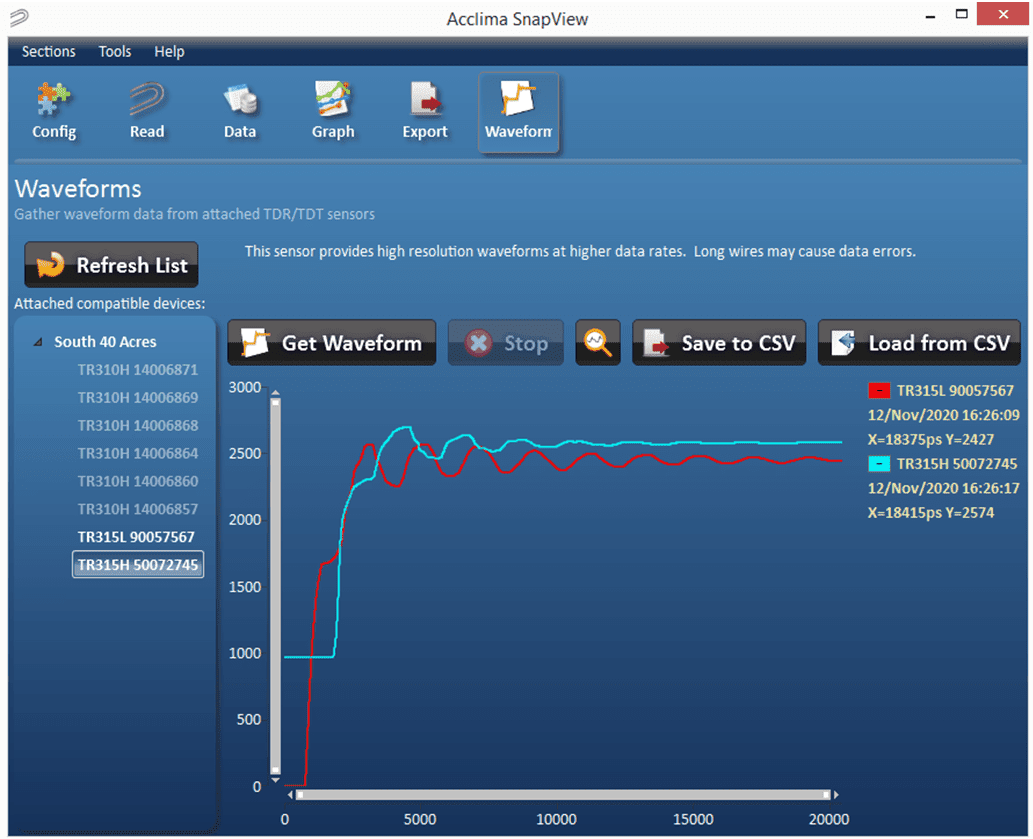
Figure 32 – Waveform Graphs
The waveform line will be color coded to the sensor from which the waveform was taken with the serial number and timestamp legend. Subsequent waveforms taken from different sensors will show up with different color codes and an extended legend.
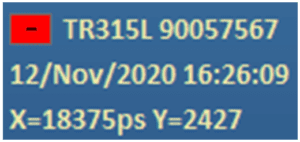
Figure 33 – Waveform Legend
The minus within the colored (e.g., red) box in the legend can be used to delete the waveform when left-clicked with the mouse.
The user can left click drag a square from upper left to lower right direction over a section of the waveform that needs closer inspection. A zoomed-in presentation of that waveform section will appear after releasing the left mouse button. To reset the graph to the full view mode just left click the ‘ Reset zoom ’ (magnifying glass icon).
Saving to CSV File

A waveform or several waveforms can be exported to a CSV file by left clicking the ‘ Save to CSV’ file.

A waveform graph can be loaded from a CSV file by left clicking the ‘ Load from CSV’ button.
NEMA rated weather-resistant polycarbonate enclosure
Length: 6.5” (16.5 cm)
Width: 6.5” (16.5 cm)
Height: .75” (12 cm)
Operating Temperature: -10 to +50°C (+14 to +122°F) Note: This limitation comes from the lithium-ion cell.
Note: The Acclima Solar DataSnap has physical limitations on what temperature range it will fully operate in. If it will be used in freezing weather (< 1°C or < 33°F) for extended periods of time, the end-user should plan to periodically have the lithium-ion 18650 battery swapped out for a fully charged replacement because the battery charging circuit is disabled at 0°C and 32°F. The battery will still run the data logger for the duration of the remaining charge but will not get recharged at or below those temperatures. When recharging backup batteries in a desktop charger, care should be taken to allow the batteries to warm up to room temperature before recharging them or the battery could be permanently damaged.
Similarly, if the temperature inside the enclosure exceeds 50°C or 122°F the battery will stop charging.
Humidity: 0 to 90% RH, non-condensing
USB Port
Input Voltage: 5VDC, ±0.5V
Input Current: 500mA Max
Solar or External Supply Input
5-10 VDC
SDI-12 Output
Signal Voltage: Typically 0-5VDC
Power Output Voltage: 12VDC
Short Circuit Current: 500mA ±20%
Contact [email protected] with questions.



Copyright Acclima ©, Inc. All rights reserved.